8 Google Analytics Reports Every CEO Should Read
Google Analytics presents a dilemma for CEOs: The tool’s metrics are invaluable for growing a business, yet the sheer amount of data can make finding valuable insights difficult.
Beyond basic traffic numbers, it’s sometimes hard to figure out what you should be paying attention to and what you should be ignoring. In particular, it’s challenging to judge which Google Analytics reports provide real strategic intelligence about the effectiveness of your digital offerings.
Moreover, if Google Analytics reports are not properly segmented, they can be very misleading, doing more harm than good.
Given this plethora of choices and potential for going astray, it’s tempting to opt out completely and simply use the tool to examine the most basic data.
Don’t fall into that trap. There are essential reports in Google Analytics that are easy to access, and which deliver accurate, truly valuable information about your customers, organization, and websites.
This group of eight reports is by no means comprehensive—each organization has specific strategies and goals that need additional measurement—but they do provide a good foundation for CEOs who want to understand how their businesses are performing.
Below are the key Google Analytics reports for CEOs, in no particular order. You can turn each into a regularly emailed report by selecting the “Email” button on the horizontal navigation bar of any dashboard.
1. Behavioral Reporting
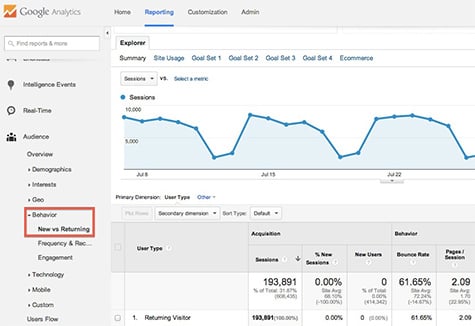
What It Is: This report delivers insights about the ratio of new vs. returning visitors arriving at a Web domain. In tandem with Frequency and Recency data, the information is extremely helpful in understanding which consumers are coming back to your site to take action.
Why It Matters: Often we default to looking at new traffic when examining Web metrics. That information is important for gauging the growth of a website, but it is often the returning visitors who truly drive conversion.
Where to Find It: Audience -> Behavior
2. Mobile
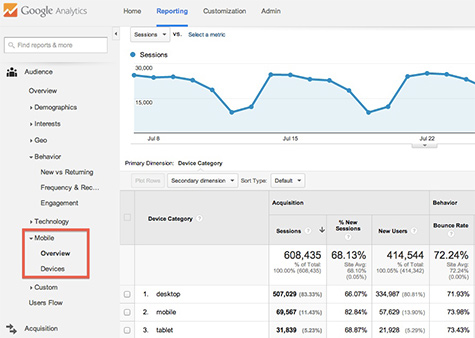
What It Is: The mobile report covers exactly what you think it would. Not surprisingly, it shows you mobile (phone and tablet) traffic data, as well as data by type of device. In addition, it provides insights for desktop traffic, allowing you to easily compare how consumers are engaging with your offerings across various platforms.
Why It Matters: Understanding who is arriving at your sites from mobile devices is more important than ever. Google has openly declared that 43% of all searches take place on mobile devices, which means that mobile accessibility is critical. This report can help you understand how effectively your company is engaging with this quickly growing audience.
Where to Find It: Audience -> Mobile
3. Acquisition – All Traffic
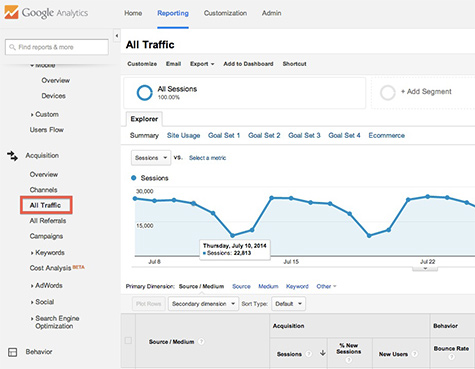
What It Is: This report shows which channels are delivering visitors to your domain. It’s more accurate than the frequently used “Channels” report, since it represents cumulative traffic over time. Goal data can be included in the report to show growth in conversion with direct correlation to traffic data.
Why It Matters: The Acquisition report makes it easy to determine if traffic from various channels is increasing or decreasing over time. It’s a smart idea to evaluate this report year-over-year or month-over-month to get a big-picture view of where your audience is coming from.
Where to Find It: Acquisition -> All Traffic
4. Organic Keywords
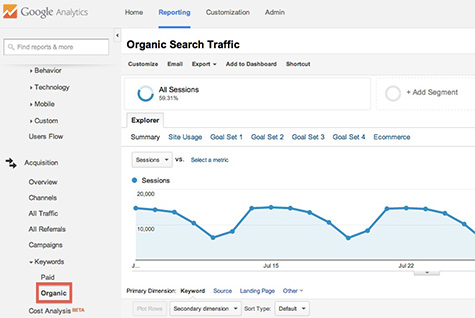
What It Is: Google’s shift to secure search over the past few years has made specific keyword data in Analytics fairly useless. The vast majority (nearly 85%) of keyword traffic now falls into the “not provided” bucket, which means you can’t see much detail on exactly which keywords are delivering organic search traffic. However, this report still allows you to see keyword traffic in aggregate, providing at least an overview of performance.
Why It Matters: The flow of organic traffic to a domain is still an extremely critical component of success on the Web. This report shows organic traffic trends over time and can be overlaid with conversion data.
Where to Find It: Acquisition -> Keywords -> Organic
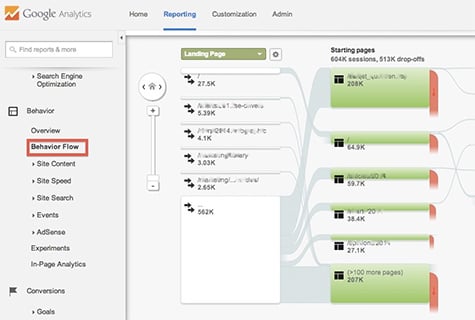
5. Behavior Flow
What It Is: This visual data shows the progression of visitors as they navigate through your site, providing insights as to which pages are converting visitors effectively and which are acting as obstacles to conversion.
Why It Matters: The Behavior Flow report removes the guesswork around your website’s engagement patterns—allowing you to clearly see what’s helping (or hurting) conversion.
Where to Find It: Behavior -> Behavior Flow
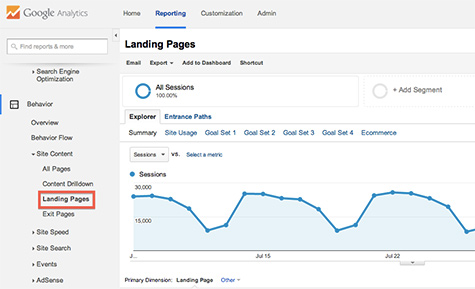
6. Site Content – Landing Pages
What It Is: This data shows how visitors are entering your site across multiple channels. It’s similar to the entrance pages report, but is more specific. Advanced segmentation makes it possible to break down the report by channel, and even device.
Why It Matters: The Landing Pages report is important for understanding what a user typically experiences first when visiting your domain—it gives you a clear sense of where consumers are starting their interactions, and can help prioritize which pages to optimize.
Where to Find It: Behavior -> Site Content -> Landing Pages
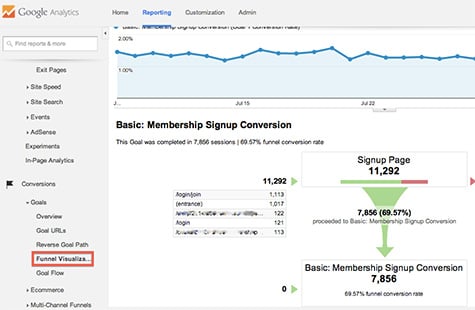
7. Goals – Funnel Visualization
What It Is: This essential report provides a clear visual showing your conversion funnel—where leads are coming from, whether they’re taking action, and where they go if they don’t covert.
Why It Matters: The Funnel Visualization report is hugely important for CEOs because it directly demonstrates how well (or not well) your website is driving new business. Visualizing the conversion funnel confirms or denies the effectiveness of your offerings, providing insight into what’s working and what’s not.
Where to Find It: Conversions -> Goals -> Funnel Visualization
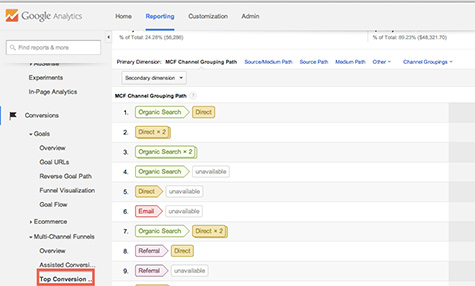
8. Multi-Channel Funnels – Top Conversion Paths
What It Is: This advanced report shows the most common channels and paths users experience before completing a conversion.
Why It Matters: The Top Conversion paths report is important for identifying how converting visitors are behaving. In most cases, it’s possible to learn about the relationships between various channels and how each contributes to a conversion, helping to prioritize which areas to focus on.
Where to Find It: Conversions -> Multi-Channel Funnels -> Top Conversion Paths
Ultimately, these reports combined can give you a proper sense of how your site is converting visits, which is the usually the key data for a CEO. After all, it’s these conversions that drive revenue. Moreover, these reports can be compared over time to prove whether or not your marketing efforts are effective.
As for how often you should get the reports, don’t feel obligated to check them constantly. While it’s important to analyze Google Analytics reports on a regular basis, it’s not necessary to look at them every day. Just set a schedule to examine the data on a consistent basis, as too frequent (or infrequent) intervals can lead you to miss important conversion and traffic trends.
Discover how to analyze and measure your data to help meet your marketing goals. Contact MDG today at 561-338-7797 or visit www.mdgsolutions.com.
MDG is a full-service advertising agency and one of Florida’s top branding firms. With offices in Boca Raton and New York City, MDG’s core capabilities include branding, logo design, print advertising, digital marketing, mobile advertising, email marketing, media planning and buying, TV and radio, outdoor advertising, newspaper, video marketing, Web design and development, content marketing, social media marketing, and SEO. To discover the latest trends in advertising and branding, contact MDG today at 561-338-7797.


