Four Tips for Designing Interactive Visualizations


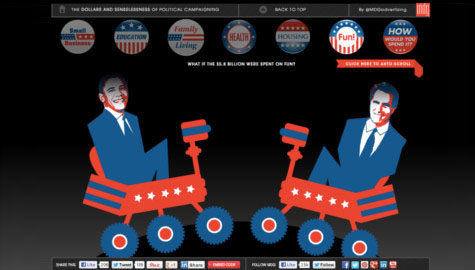
Visuals have the power to engage, entertain, educate, and excite audiences, especially when those images are interactive visualizations. While static graphics such as photos and infographics can be incredibly useful, interactive visualizations allow marketers to simplify data and tailor content to provide a much more engaging viewer experience. To help Web designers create even more captivating interactive visualizations, Business2Community.com featured the following four ideas.
1. Opt for On-Demand Highlighting & Details – When designing interactive visualizations it can be relatively easy to emphasize certain content, but it’s not always so simple to choose the best data from a sea of useful information. The solution is to condense the data into separate sections, such as pop-up windows, that enable audiences to view specific content on-demand while still having the ability to access all of the information.
2. Utilize User-Driven Content Selection – To increase engagement and interactivity even further, put the user in charge of the content they see. Feature options for the different data they can view in the interactive visualizations, and then have the images update automatically based on their selections.
3. Make Use of Multiple Coordinated Visualizations – Maximize the impact and amount of data shown by using many interactive visualizations instead of only one. This allows designers to display a variety of data simultaneously to provide audiences with a more comprehensive picture and complete understanding.
4. Display Data in Diverse Ways – While multiple coordinated visualizations can show much more data, they also leave much less screen space and can be overwhelming when the information is abundant. The answer is to provide different viewing settings so audiences can restructure the visualization based on the content they desire. This still allows viewers to see a multitude of images, but now they’re viewable one at a time.
As you can see, interactive visualizations can be extremely effective and useful when conveying a large amount of data. When designing interactive visualizations, try to apply these innovative techniques for a viewer experience that’s more impactful.
To learn more about providing your customers with a more engaging viewer experience through interactive visualizations, contact MDG today at 561-338-7797 or visit www.mdgsolutions.com.
MDG, a full-service Florida advertising firm with offices in Boca Raton and New York, NY, specializes in developing targeted Internet marketing solutions, exceptional creative executions and solid branding and media buying strategies that give clients a competitive advantage. Our core capabilities include branding, logo design, advertising campaigns, digital marketing, print advertising, direct mail marketing, media planning and buying, radio and TV advertising, video, Web design and development, infographics, interactive visualizations, email marketing, social media marketing, and SEO.
Read more at business2community.com.
